Latest 2026 Survey: Instagram Purchasing Behavior of 636 Japanese Consumers
- 1. How Often Does Instagram Trigger a Purchase?
- 1-1. Nearly 40% of Japanese Users Purchase via Instagram at Least Once a Month
- 1-2. Younger Generations Embrace Instagram as a Primary Shopping Hub
- 1-3. Over 40% of Japanese Women Use Instagram as a Monthly Shopping Companion
- 2. From Discovery to Conversion: Navigating the Japanese Path to Purchase
- 2-1. The Search Engine Safety Net: 46.76% of Users Conduct External Research
- 2-2. Generative Differences in Verifying Information Among Japanese Consumers
- 2-3. Over 36 Percent of Women Maximize the Save Function for Careful Consideration
- 3. Japanese Purchasing Categories Triggered by YouTube
- 3-1. Household Goods, Beauty, Fashion, and Food Emerge as Leading Categories
- 3-2. Over 43 Percent of Teenagers Invest in Beauty and Cosmetics
- 3-3. Men Focus on Hobbies and Utility While Women Prioritize Beauty and Lifestyle
- 4. Factors Driving Purchase Decisions Among Japanese TikTok Users
Instagram has evolved from a platform for chasing aesthetics into an essential infrastructure that dictates the purchasing decisions of Japanese consumers. No longer just a space to admire aspirational lifestyles, it has transformed into a massive digital catalog directly linked to daily transactions.
However, Japanese consumer behavior is not so simple that a visual spark alone will trigger a sale. Their wallets do not open based solely on a pretty picture. How do they scrutinize the posts they see, and what specific process leads them to finally hit the payment button?
In this report, we conducted an extensive survey of 636 Japanese Instagram users to uncover the reality of their behavior. From the surprising fact that 40% of users make a purchase at least once a month to their meticulous research habits for verifying information, we reveal the genuine motives behind their buying decisions based on the latest 2026 data.
How Often Does Instagram Trigger a Purchase?
With its power to deliver instant visual gratification, Instagram has firmly established itself as a primary touchpoint in the daily shopping journey of Japanese consumers. To begin our analysis, we looked into the actual frequency of these transactions—specifically, how often users transition from scrolling through their feeds to taking definitive purchasing action.
Nearly 40% of Japanese Users Purchase via Instagram at Least Once a Month
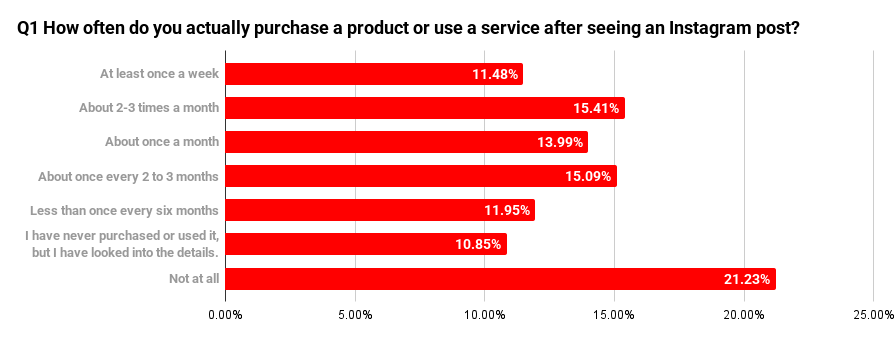
Our survey of 636 Japanese Instagram users reveals a wide spectrum of consumer behavior, ranging from highly active shoppers to those in the early stages of product consideration.
The breakdown of purchasing frequency highlights a significant group of frequent buyers:
・Weekly or more: 11.48% (73 respondents)
・2–3 times per month: 15.41% (98 respondents)
・Once a month: 13.99% (89 respondents)
When combined, these figures indicate that roughly 4 in 10 users engage in Instagram-driven commerce at least once every month.
The data for other frequencies is as follows:
・Once every 2–3 months: 15.09% (96 respondents)
・Once every 6 months or less: 11.95% (76 respondents)
Beyond direct conversions, the survey also identified a notable segment of high-intent prospects. Approximately 10.85% (69 respondents) reported that while they have yet to make a purchase, they have actively researched product details after seeing a post. On the other end of the spectrum, 21.23% (135 respondents) stated they have never made a purchase triggered by the platform.
These results underscore Instagram’s dual role in the Japanese market. It has firmly established itself as a versatile platform that caters to both the buy now impulse and the research first mindset, supporting the user’s journey from initial discovery to final evaluation.
Younger Generations Embrace Instagram as a Primary Shopping Hub
When we analyze usage patterns by age group, it becomes starkly evident that Instagram has evolved into an essential everyday shopping infrastructure for younger Japanese consumers.
This trend is most prominent among users in their 20s, where 24.35% (28 respondents) reported purchasing at least once a week—the highest figure across all demographics. Similarly, 21.43% (15 respondents) of teenagers shop weekly via the platform. For these trend-conscious young people, Instagram serves as a digital storefront that they visit as often as, or even more frequently than, a physical retail location.
In contrast, while the frequency tends to stabilize as age increases, the 30s demographic represents a consistent market, with 21.74% (25 respondents) making purchases about once a month.
Among users aged 40 and above, there is a higher percentage of those who have never purchased via the platform (26.72% for those in their 40s and 32.47% for those in their 50s). However, a dedicated segment remains active: 17.24% (20 respondents) in their 40s and 15.58% (12 respondents) in their 50s shop through Instagram two to three times a month.
These findings suggest that for the adult demographic in Japan, purchasing intent can be effectively triggered as long as the content aligns closely with their specific hobbies or lifestyle preferences.
Over 40% of Japanese Women Use Instagram as a Monthly Shopping Companion
When breaking down purchasing frequency by gender, a clear distinction emerges: approximately 41% of Japanese women now shop via Instagram at least once a month.
The data for female users shows a remarkably consistent integration into their daily lives:
・Weekly or more: 13.33% (38 respondents)
・2–3 times per month: 13.68% (39 respondents)
・Once a month: 14.04% (40 respondents)
For these women, Instagram has evolved into a deeply embedded tool for discovering and selecting everyday items.
In contrast, the behavior of Japanese men presents a different, more polarized pattern. While a dedicated segment of high-frequency male shoppers exists—with 9.97% (35 respondents) shopping weekly and 16.81% (59 respondents) shopping 2–3 times a month—there is also a significant group of cautious browsers.
Key differences in the browsing-only segment include:
・Men who have never purchased: 23.36% (82 respondents)
・Women who have never purchased: 18.60% (53 respondents)
These results suggest that while the hurdle for converting Japanese male users may be higher due to more stringent selection criteria, they are highly likely to become frequent, loyal shoppers once a product aligns perfectly with their specific needs or standards.
From Discovery to Conversion: Navigating the Japanese Path to Purchase
When a visual spark ignites interest on Instagram, do Japanese consumers pull the trigger immediately? Or do they embark on a cautious journey of cross-platform comparison before committing to a purchase?
In this section, we take a deep dive into the real-world behavior of the 432 respondents who have made at least one purchase via the platform. We tracked their journey from the initial moment of product discovery to the final decision, uncovering the meticulous steps they take before hitting the buy button.
The Search Engine Safety Net: 46.76% of Users Conduct External Research
An analysis of the 432 respondents with actual purchase history reveals that for Japanese consumers, the journey rarely ends within the Instagram app. Instead, they actively seek external validation to finalize their decisions.
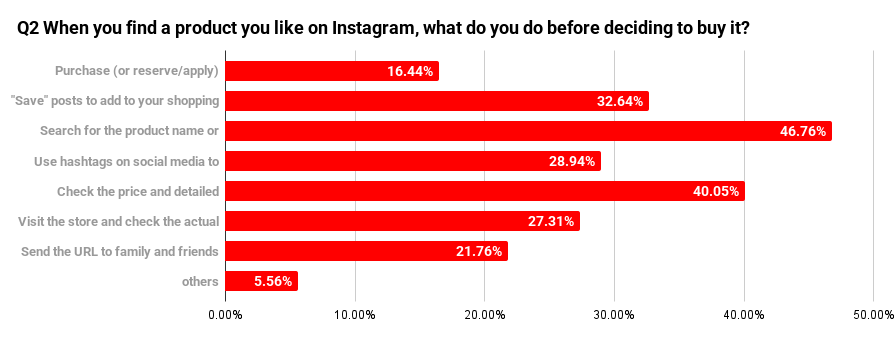
The most common post-discovery action is performing a follow-up search for the product or brand name on search engines like Google, a behavior reported by 46.76% (202 respondents).
Other key steps in this multi-layered verification process include:
・Comparing prices and specifications on official websites or major e-commerce platforms such as Amazon: 40.05% (173 respondents).
・Using the Save feature to create a personal wishlist for future consideration: 32.64% (141 respondents).
・Digging for authentic user reviews via hashtags within social media to find unbiased opinions: 28.94% (125 respondents).
・Visiting a physical store to inspect the item in person before committing: 27.31% (118 respondents).
Interpersonal validation also plays a role, with 21.76% (94 respondents) sharing URLs with family or friends for a second opinion.
In contrast, the segment of impulsive buyers—those who purchase, book, or apply immediately on the spot—remains a minority at just 16.44% (71 respondents). Other actions accounted for 5.56% (24 respondents).
These findings underscore a vital reality of the Japanese market: while Instagram is an incredibly powerful engine for brand awareness, most consumers require a multi-step journey to gain the confidence and peace of mind necessary to click the buy button.
Generative Differences in Verifying Information Among Japanese Consumers
A recent comparison across different age groups reveals distinct methods for cross-checking information among Japanese users. For Japanese individuals in their 40s, there is a clear emphasis on official data and accuracy. This demographic showed a strong preference for double-checking details, with 61.33 percent performing follow-up searches for brand or product names on search engines like Google. Furthermore, 56 percent reported visiting official websites or major e-commerce platforms such as Amazon to verify pricing and technical specifications. These figures highlight a characteristically cautious approach among mature Japanese adults who prioritize reliable, primary sources.
In contrast, the behavior of Japanese teenagers reflects a shift toward personal curation within digital spaces. Forty-five percent of this group indicated that they use the save feature on social media posts to build custom shopping lists for future purchases. This suggests that creating a personalized digital catalog within an app has become a standard practice for the youngest generation.
The 20s demographic displays a different pattern focused on peer-to-peer validation. Roughly 39.39 percent of these individuals use hashtags within social media platforms to seek out authentic reviews from everyday users. This behavior is a hallmark of Japan’s digital natives, who tend to place greater trust in the unvarnished opinions of their peers than in corporate advertisements.
Finally, the survey highlights a preference for physical interaction among Japanese seniors. For those in their 60s, 35.29 percent prefer visiting a brick-and-mortar store to inspect a product in person before committing to a purchase. This trend underscores the enduring value that older Japanese generations place on tangible, real-world experiences.
Over 36 Percent of Women Maximize the Save Function for Careful Consideration
An analysis of behavioral differences by gender has revealed a clear disparity in the purchasing speed of Japanese consumers. Japanese men tend to be more decisive, with 18.88 percent reporting that they make an immediate purchase, reservation, or application on the spot. In comparison, only 13.56 percent of Japanese women make such instant decisions. This male decisiveness is further supported by the fact that 42.49 percent of men prioritize verifying prices and technical specifications on official websites or major e-commerce platforms like Amazon. These results suggest that Japanese men are quick to take action once they are satisfied with the functional data of a product.
On the other hand, Japanese women display a more methodical approach to gathering and organizing information. A significant 36.18 percent of women utilize the save function on social media to build lists for future consideration, effectively curating potential purchases during their spare time throughout the day.
Furthermore, the preference for physical verification is stronger among women, with 30.15 percent choosing to visit a brick-and-mortar store to inspect a product in person. This figure surpasses the 24.89 percent recorded for men. This data reflects a cautious consumer psychology unique to Japanese women, who often prefer to confirm the actual texture and quality of an item with their own eyes to ensure a satisfying purchase and avoid any potential disappointment.
Japanese Purchasing Categories Triggered by YouTube
What specific categories are Japanese consumers spending their money on? A survey into the reality of consumption reveals how the unique characteristics of media like Instagram are deeply reflected in what people buy.
Household Goods, Beauty, Fashion, and Food Emerge as Leading Categories
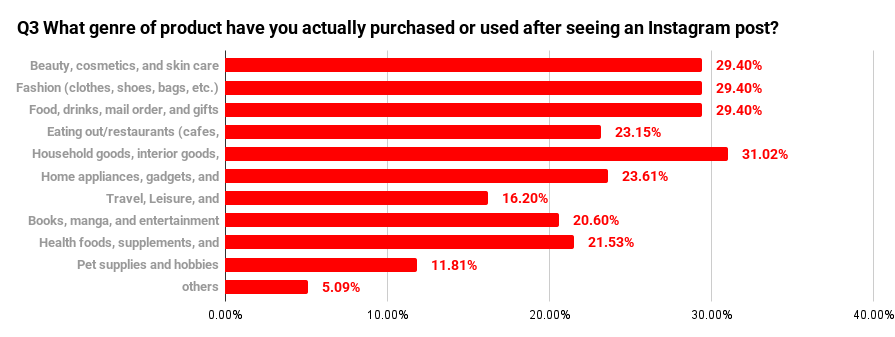
Data collected from 432 Japanese consumers who have purchased items via Instagram reveals that spending is distributed across a remarkably broad spectrum of interests. The most popular category was household goods, interior decor, and kitchenware, accounting for 31.02 percent of respondents. This suggests that visual content showcasing items that enhance daily life resonates deeply with Japanese aesthetic sensibilities.
Following closely behind, three distinct categories each garnered high levels of support at 29.40 percent: beauty and skincare, fashion including apparel and accessories, and the food and beverage sector, which encompasses gourmet deliveries and gifts.
The influence of social media also extends into more technical and lifestyle-oriented areas. Home appliances and mobile gadgets accounted for 23.61 percent of purchases, while dining out at cafes and restaurants followed at 23.15 percent. Additionally, 21.53 percent of users invested in health foods, supplements, and fitness equipment.
In other sectors, books and digital entertainment reached 20.60 percent, travel and lodging stood at 16.20 percent, and pet supplies or hobby-related items made up 11.81 percent. A small segment of 5.09 percent fell into miscellaneous categories.
These findings make it clear that Instagram has evolved far beyond a mere hub for fleeting trends. For the Japanese consumer, it has become a primary starting point for a wide array of purchasing decisions, ranging from essential daily necessities to specialized personal interests.
Over 43 Percent of Teenagers Invest in Beauty and Cosmetics
Analyzing purchase categories by age group highlights how Japanese consumers adapt their use of Instagram to suit their specific stage of life. For Japanese teenagers, beauty, cosmetics, and skincare products ranked exceptionally high at 43.33 percent. This suggests that for the youngest generation, the platform has become an indispensable resource for self-improvement and personal grooming.
Among Japanese individuals in their 20s, beauty products and fashion items including clothing, shoes, and bags both recorded a strong 32.32 percent. These figures indicate that younger demographics are particularly driven by purchases related to physical appearance and the latest trends.
In contrast, the focus of mature generations shifts toward internal well-being and the home environment. For Japanese consumers in their 40s, the food and beverage category—encompassing gourmet direct-delivery items and gifts—reached 44 percent. This demonstrates a clear desire among adults to seek out high-quality culinary experiences through social media.
Furthermore, Japanese seniors in their 60s showed the highest interest in household goods, interior decor, and kitchenware at 41.18 percent. The survey reveals that for older generations in Japan, Instagram serves as a powerful visual catalog. By providing a clear image of how items fit into a finished living space, the platform has become a key tool for those looking to enhance their comfort while spending time at home.
Men Focus on Hobbies and Utility While Women Prioritize Beauty and Lifestyle
A survey into category preferences by gender reveals a significant divide in the types of information Japanese men and women seek on Instagram. For Japanese women, beauty, cosmetics, and skincare products claimed a dominant first place at 43.72 percent. This was followed by fashion items such as clothing, shoes, and bags at 32.16 percent, and household goods, interior decor, and kitchenware at 31.16 percent.
In contrast, Japanese men do not concentrate their interest on a single category as heavily as women do, showing engagement across a much broader range of interests. The most popular categories for men were food and beverages—including gourmet deliveries and gifts—and household goods, both tied at 30.90 percent. Furthermore, interest in home appliances, gadgets, and smartphone accessories reached 27.90 percent among men, significantly outstripping the 18.59 percent recorded for women.
The data also shows that books, manga, and entertainment content reached 25.75 percent among male respondents. These results suggest that for Japanese men, Instagram serves as a practical tool for enhancing daily convenience and diving deeper into personal hobbies and niche interests.
Factors Driving Purchase Decisions Among Japanese TikTok Users
What are the ultimate deciding factors that convince Japanese consumers to finalize a purchase? To identify these key drivers, a survey was conducted with 432 Japanese individuals who have experience buying products through the platform. The goal was to look beyond simple brand awareness and pinpoint the specific qualities of information that push users to complete a transaction.
Over 37 Percent of Users Decide Based on One-Minute Summary Videos
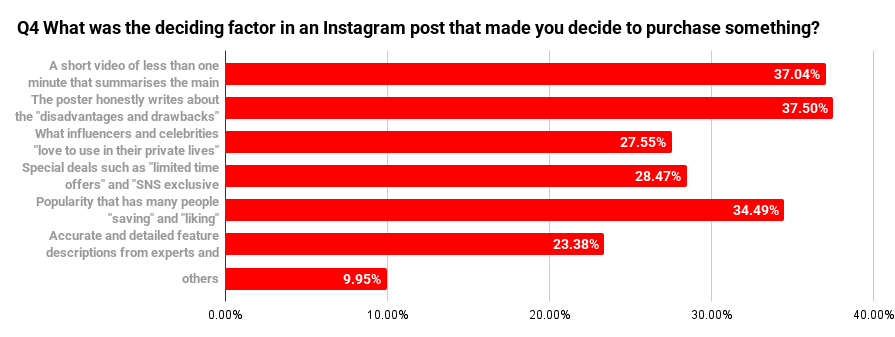
An analysis of responses from 432 Japanese consumers who completed a purchase reveals that creator integrity and time efficiency, often referred to in Japan as time-performance, are the primary keys to conversion. The most significant factor, cited by 37.50 percent of respondents, was the inclusion of honest feedback regarding drawbacks or flaws. This suggests that Japanese users value transparency and a balanced perspective over purely positive promotion.
Closely following this, 37.04 percent noted that brief videos under one minute that effectively summarize the core appeal of a product were a decisive factor. The perceived popularity of an item also plays a major role, with 34.49 percent influenced by high engagement metrics such as a large number of saves and likes.
Other influential elements include practical incentives and celebrity endorsements. Specifically, 28.47 percent were motivated by limited-time offers or social-media-exclusive coupons, while 27.55 percent were swayed by seeing influencers or celebrities using products in their personal lives. Furthermore, 23.38 percent of Japanese consumers looked for accurate and detailed functional explanations provided by experts or official sources. A small segment of 9.95 percent attributed their decisions to other miscellaneous factors.
These findings indicate that while Instagram is known for its polished aesthetic, the actual triggers for a Japanese consumer’s purchasing decision are clarity and efficiency. Information that allows users to quickly understand both the benefits and the potential risks of a product is what ultimately drives them to the checkout.
Younger Generations Value Authenticity and Personal Use
Comparing survey results across different age groups reveals that the deciding factors for making a purchase are clearly divided along generational lines in Japan. A particularly striking finding involves Japanese consumers in their 40s, where over half—53.33 percent—cited short videos under one minute that summarize key points as their primary reason for buying. This was the highest percentage across all age groups, suggesting that for busy Japanese adults, the ability to consume information efficiently through video significantly accelerates their purchasing decisions.
In contrast, younger Japanese consumers place a higher premium on a sense of raw realism and relatable proximity. Among teenagers, 43.33 percent pointed to the honest inclusion of drawbacks or flaws by the content creator as a major influence. This indicates a strong desire for truthful information that is free from the typical polish of a paid advertisement.
For those in their 20s, personal connection plays a larger role, with 36.36 percent being moved to purchase when they see influencers or celebrities using products in their actual daily lives. This combination of aspiration and empathy serves as a powerful driver for the Japanese youth market.
Furthermore, among those aged 50 and older, social proof remains a cornerstone of trust, with approximately 40 percent relying on high engagement metrics such as likes and saves. These results reflect a broader Japanese cultural trait of using the collective evaluation of others as a reliable benchmark for quality and credibility.
Nearly 40 Percent of Women Value the Disclosure of Product Flaws
An investigation into decision-making criteria by gender reveals distinct ways that Japanese men and women evaluate information. For Japanese women, a significant 39.70 percent prioritize content where the creator honestly discusses drawbacks or flaws. This reflects a strong psychological drive to minimize risk and avoid potential dissatisfaction with a purchase. Additionally, 36.68 percent of women are influenced by social buzz, such as a high volume of likes and saves, using community engagement as a cornerstone of trust.
In contrast, Japanese men tend to prioritize efficiency and objective data. Roughly 38.63 percent of men favor short videos under one minute that summarize a product’s appeal, showing a preference for understanding the core value in the shortest time possible. Furthermore, 25.32 percent of men look for accurate and detailed functional explanations from experts or official sources, a figure that surpasses the 21.11 percent recorded for women.
These findings highlight a clear divide in Japanese consumer behavior. While women often look for emotional transparency and social validation, men are more likely to seek logical satisfaction and streamlined information.
Average Amount Spent by Japanese Consumers Triggered by YouTube Content
The amount of money exchanged in a single transaction is a vital metric for measuring a platform’s economic influence. To understand this impact, a survey was conducted to determine the actual average spending habits of Japanese users—ranging from small daily purchases to significant personal investments.
Approximately 70 Percent of Purchases Fall Between 1,000 and 5,000 Yen
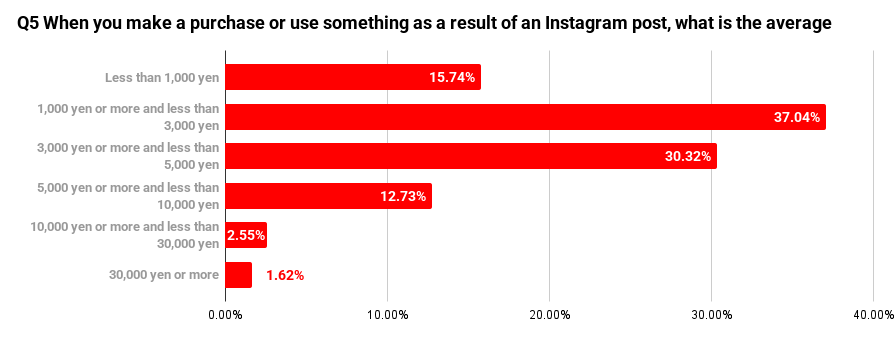
An analysis of responses from 432 Japanese consumers who have made a purchase reveals that Instagram is most effective at driving sales for items that slightly enhance daily life without breaking the bank. The most common spending bracket was between 1,000 and 3,000 yen, accounting for 37.04 percent of respondents. This was closely followed by the 3,000 to 5,000 yen range at 30.32 percent. Collectively, nearly 70 percent of Japanese users are completing transactions valued at under 5,000 yen.
In other price brackets, 15.74 percent of purchases were for items costing less than 1,000 yen, while 12.73 percent fell between 5,000 and 10,000 yen. High-ticket items saw significantly less movement, with only 2.55 percent of users spending between 10,000 and 30,000 yen, and a mere 1.62 percent spending over 30,000 yen.
These results indicate that for the Japanese market, Instagram acts as a powerful catalyst for impulse buys and small upgrades to everyday essentials. The platform excels in price ranges where the psychological barrier to making a decision is relatively low, encouraging consumers to indulge in modest luxuries.
Even Among Those in Their 40s, Over 45 Percent Spend Between 1,000 and 3,000 Yen
An investigation into purchasing amounts by age group reflects how the financial sensibilities of Japanese consumers shift according to their stage of life. For Japanese teenagers, who often have a limited amount of discretionary income, 45 percent reported spending between 1,000 and 3,000 yen, while 30 percent spent less than 1,000 yen. Combined, three-quarters of this demographic keep their expenditures under the 3,000 yen mark.
Interestingly, even among older generations with more stable incomes, Instagram consumption remains notably practical. For Japanese adults in their 40s, 45.33 percent stay within the 1,000 to 3,000 yen range, a trend mirrored by those in their 60s at 47.06 percent. Across almost all age groups, the platform is primarily used for purchases in a price range where the financial risk of a mistake is minimal.
However, a slight shift toward mid-range spending was observed among Japanese individuals in their 50s. In this group, 17.78 percent reported spending between 5,000 and 10,000 yen, a higher figure than in other age brackets. This suggests a specific consumption trend among mature Japanese adults who are willing to invest a bit more in specialty items they discover and genuinely like on Instagram, even if the price is somewhat higher.
Nearly 59 Percent of Women Keep Purchases Under 3,000 Yen
An investigation into spending habits by gender has revealed that Japanese women skillfully navigate the low-to-mid price ranges, while men tend to set a higher budget per transaction. For Japanese women, 40.70 percent spent between 1,000 and 3,000 yen, and 18.09 percent spent less than 1,000 yen. Together, nearly 59 percent of women keep their spending under 3,000 yen. This paints a picture of Japanese women using Instagram for smaller, frequent purchases that brighten their daily lives, such as cosmetics and everyday consumables.
In contrast, Japanese men show a more balanced distribution between price points. While 33.91 percent spend in the 1,000 to 3,000 yen range, an almost equal 33.05 percent spend between 3,000 and 5,000 yen. Furthermore, high-value transactions exceeding 30,000 yen accounted for 2.58 percent of male respondents, notably higher than the 0.50 percent recorded for women. These results highlight a distinct consumption style among Japanese men, who are willing to pay a premium for high-performance gadgets or hobby-related items when they trust the information they find on Instagram.
Japanese Consumers Seek Authenticity on Instagram
The results of this survey reveal a clear reality: Instagram has effectively become a digital catalog, with approximately 40 percent of Japanese users making a purchase at least once a month. In the current landscape, an aesthetically pleasing post is merely the starting point. Japanese consumers only proceed to checkout after conducting their own thorough due diligence through follow-up searches and peer reviews to ensure total satisfaction.
What Japanese users crave most today is the honest disclosure of potential drawbacks. This raw, unvarnished truth is the critical switch that transforms a standard advertisement into trustworthy information.
At hotice, we specialize in understanding the rigorous psychological barriers of the Japanese consumer to craft Instagram strategies that drive measurable results. Our approach goes beyond simple brand awareness; we focus on the strategic use of video and imagery designed specifically to convert viewers into buyers. Why not partner with hotice to discover the ultimate solution for turning engagement into sales?
.jpg)